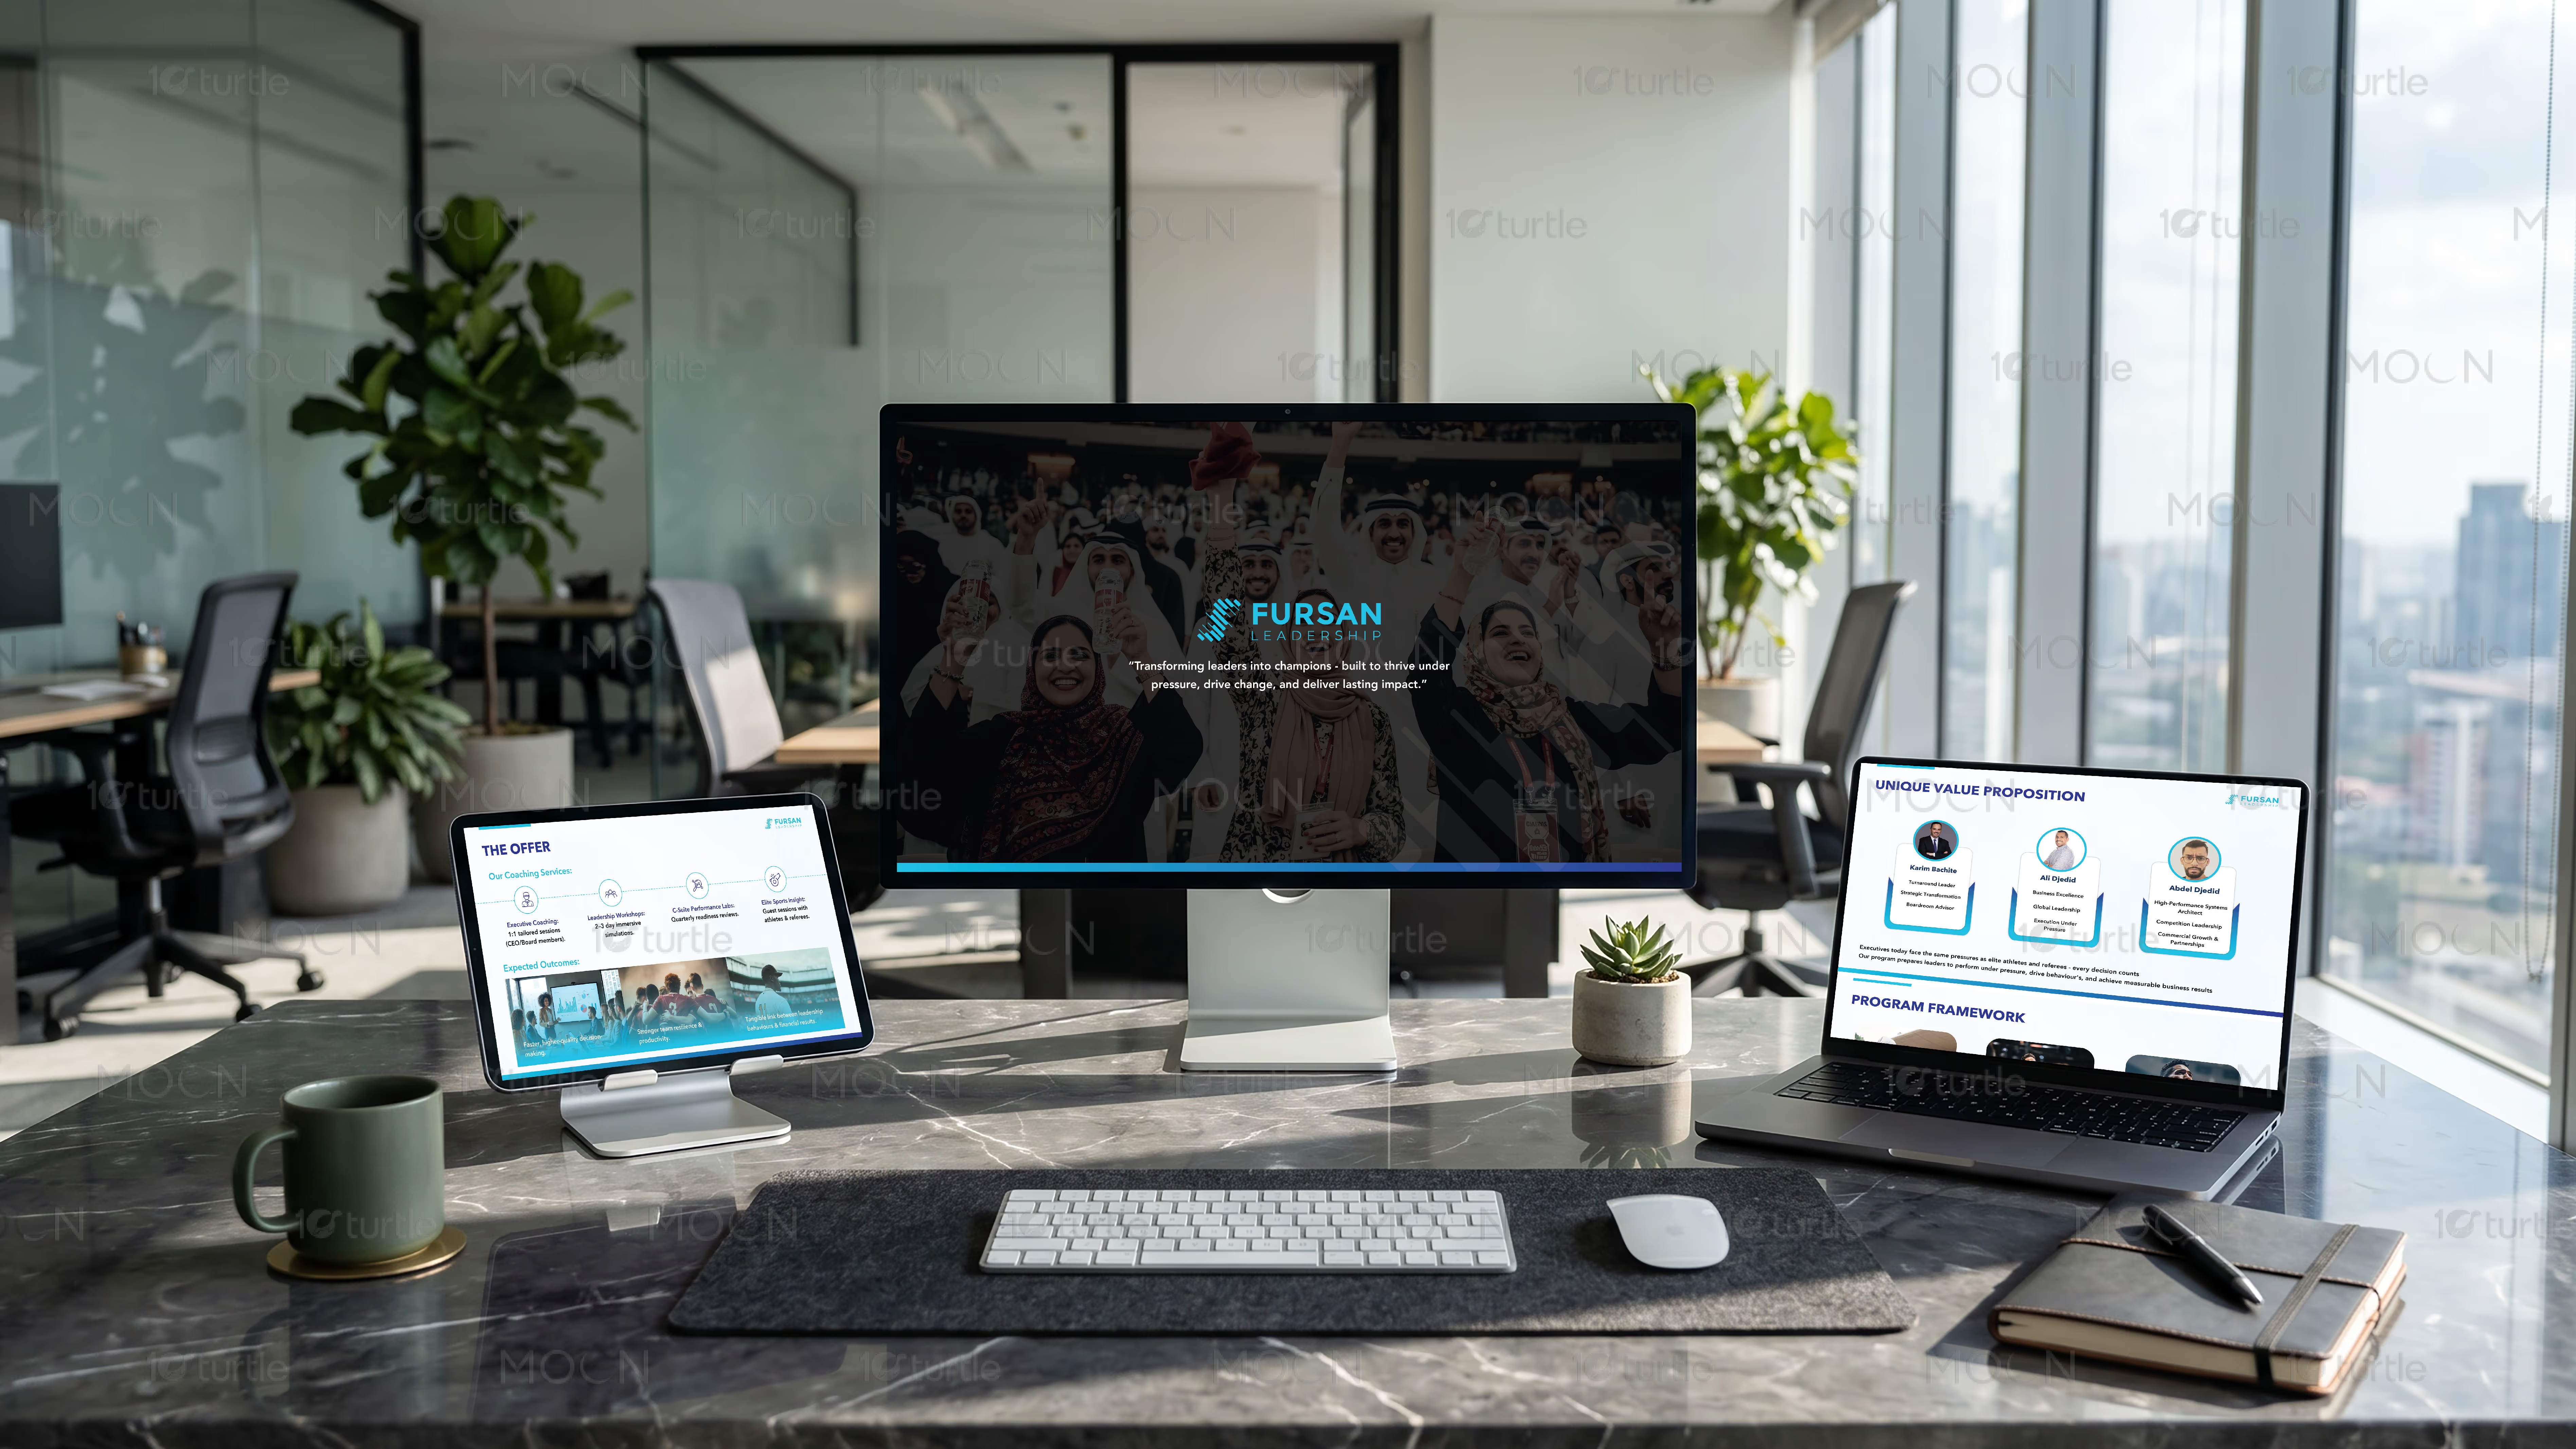
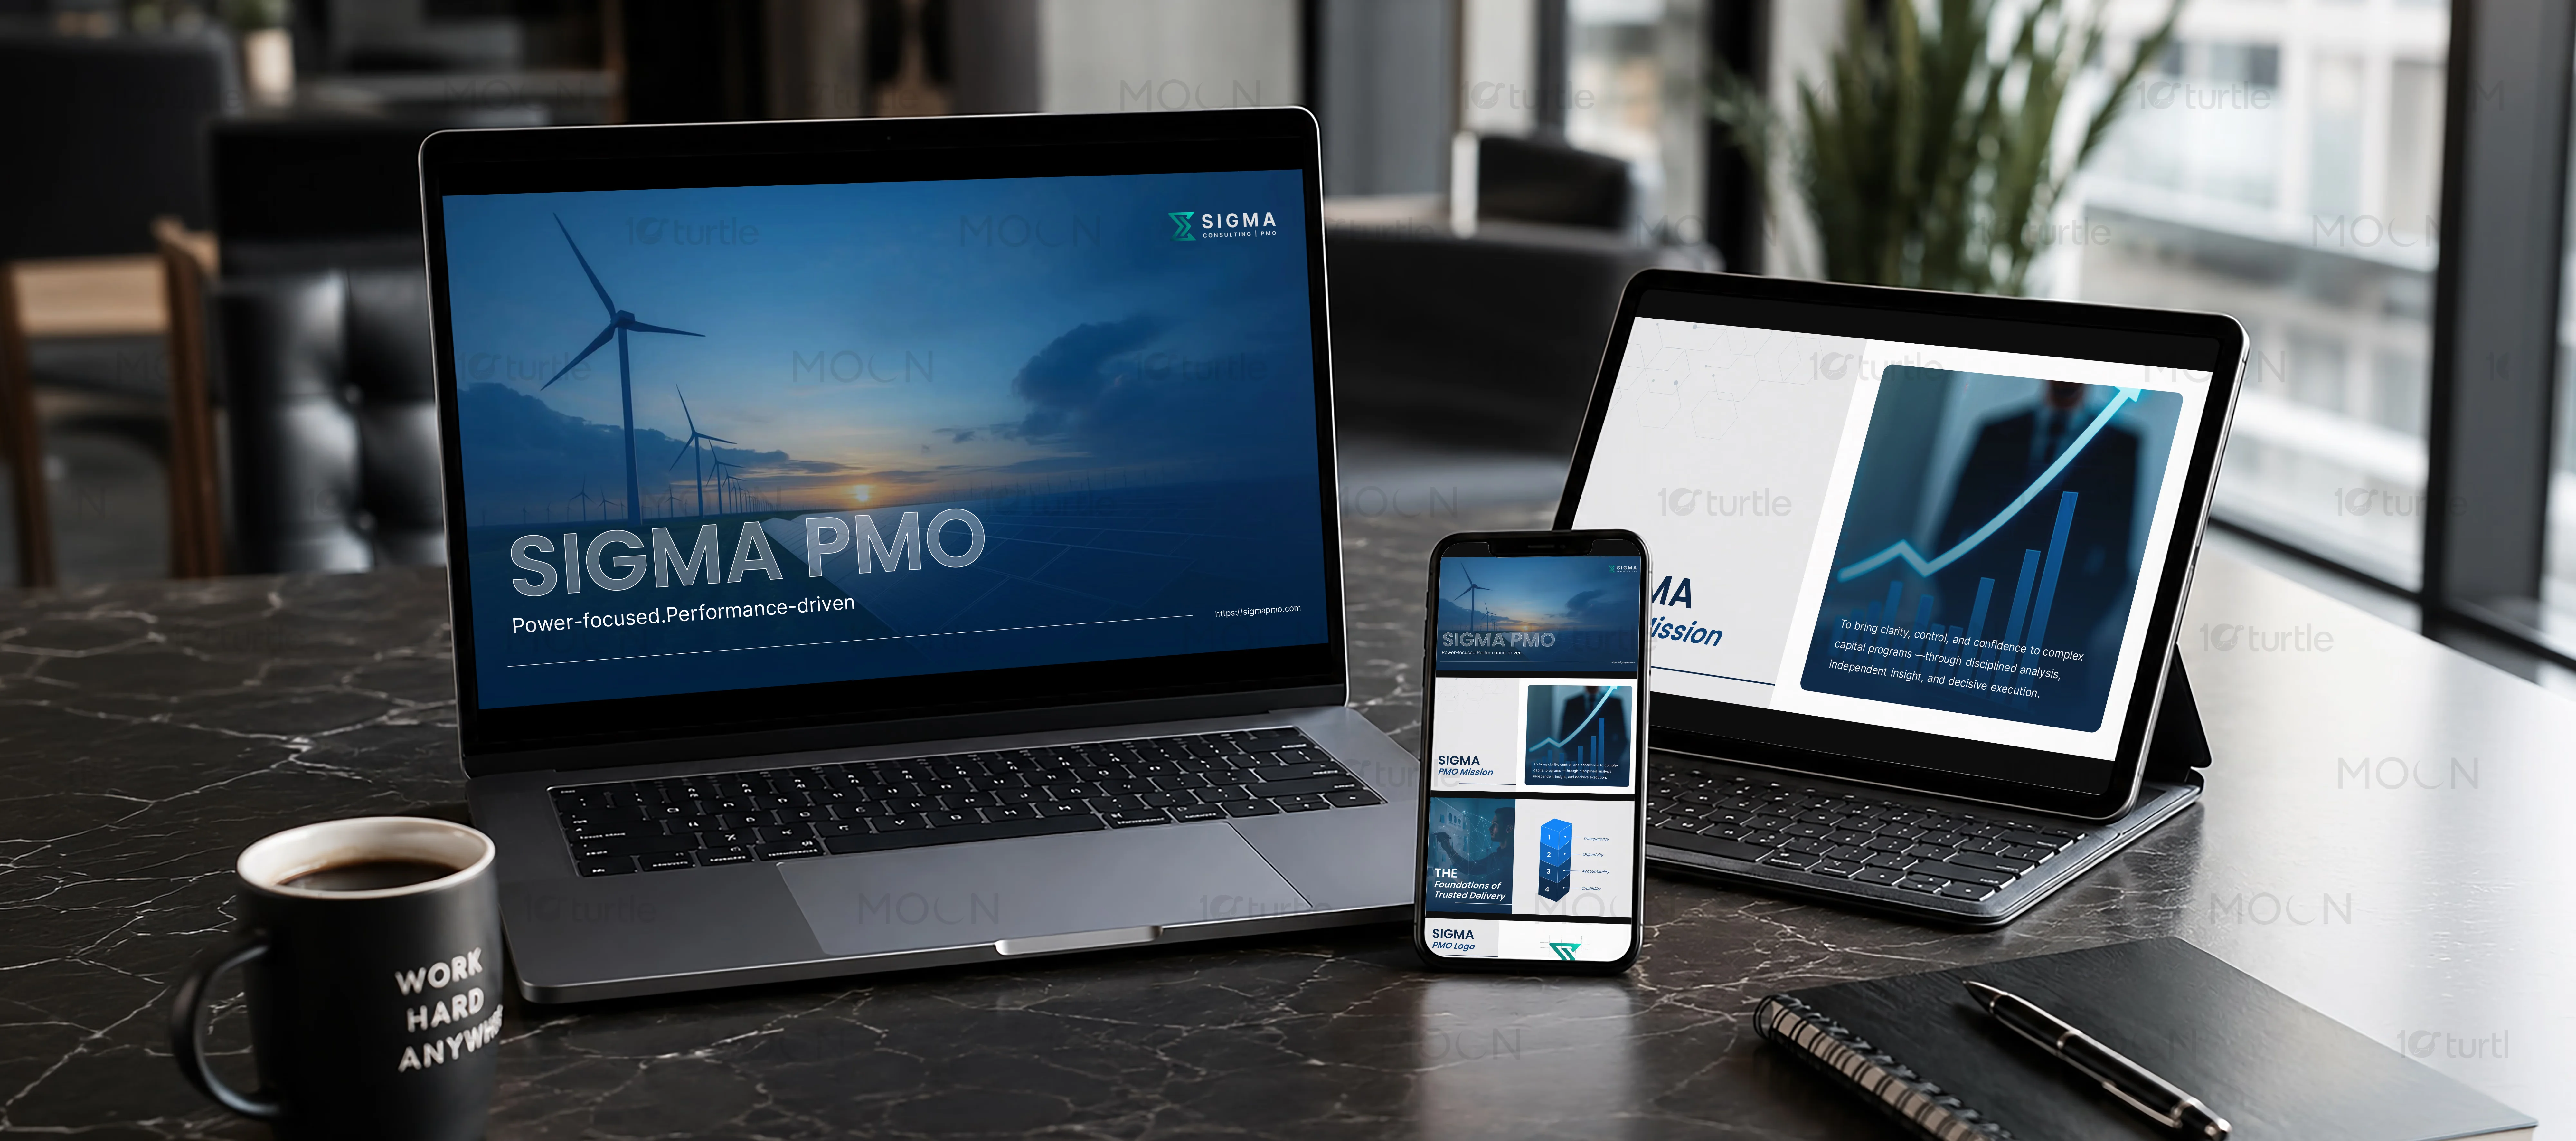
High contrast corporate graphics and data visualization design for energy consulting projects to align complex technical stakeholders.
Editorial Design
Visual Identity
Typography System
Industry
technology
Tools we used


Project Completion
2025
Key Market
Global
Industry
technologyWhat we did
Platform
-Energy consulting projects involve enormous quantities of technical data, structural timelines, and operational dependencies that easily overwhelm stakeholders in standard textual formats. The primary challenge was that dense project management charts and unaligned spreadsheets caused cognitive fatigue during crucial executive presentations, burying high-value milestones in cluttered slides. The brand needed a graphic system that could simplify this extreme visual complexity without losing the technical precision expected of seasoned consulting experts.
We designed an elite corporate graphic system based on a strict mathematical layout grid and a purposeful color palette of deep charcoal and high-contrast clean-energy green. Every flowchart, process node, and performance metric was rebuilt as a custom vector asset, ensuring visual consistency across all slides and technical reports. By pairing clean sans-serif typography with generous spatial breathing room, we created an intuitive, scannable reading flow that directs attention to critical pathways instantly.